Many Quality and Regulatory Systems such as ISO 9001 or AS13100 include statements like “Supplier shall perform MSA on all measurement systems used to measure ‚Critical‘ or ‚Key‘ characteristics.” A common element in this MSA is a Gauge R&R (Repeatability and Reproducibility) study.
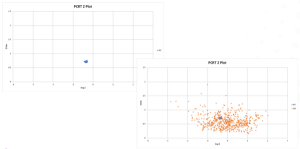
Resonance frequency measurements are very precise, and our custom-PCRT fixtures deliver excellent repeatability. But simply knowing that that you can make repeatable measurements within 0.012% standard deviation doesn’t help everyone understand how repeatable PCRT inspection results will be. We can show you how repeatable the Z-score calculation will be for our ‚margin‘ shots (which estimate measurement repeatability). But until we show you THE WHOLE POPULATION, you can’t interpret the numbers. Very few customers come to us with a specification (or even suggestion) of what resonant frequencies for their parts should be, or how much variation should be in an acceptable population.

While the first plot shows the distribution of repeat measurements, without the population context on the second plot, we don’t know the RELEVANCE of the repeatability. To evaluate the effectiveness of a gauge, we must know how much both repeat measurements AND POPULATION MEASUREMENTS will vary.
What is Gauge R&R? Should I study measured values or inspection results (Pass/Fail)?
In a Gauge R&R study, the gauge error (Equipment Variation) is compared to the overall measurement error, which typically also includes operator error (Appraiser Variation) and population error (Part Variation). Measurement Systems that have the R&R error (combination of Equipment and Appraiser Variation) less than 10% of the Total Variation are said to be acceptable. Another way to look at the acceptability of the GRR results is to examine how many ‚distinct categories‘ the measurement R&R puts the population into. This is where the 0.012% standard deviation question comes into play. If the population variation is 0.015%, and the gauge’s error is 0.012%, then the gauge doesn’t do a very good job of distinguishing the ‚lowest measurement from the highest measurement‘ in the population. However, if the population variation 0.250% and the gauge’s error is 0.012%, then the gauge divides the population into more than 20 distinct categories. The minimum value for an acceptable gauge by this measure is typically 5.

Performing an accurate quantitative GRR study like this requires that the population of parts included in the study actually represents the true PART VARIATION expected. If the study just includes ’10 parts in a row taken from the production line‘, these may not really represent the full range of possible part variation and can underestimate the effectiveness of the gauge to distinguish within the population. Sometimes it is hard to KNOW how to get your GRR sample to represent the true population variation. This uncertainty tends to encourage folks to do an ‚attribute‘ study instead.
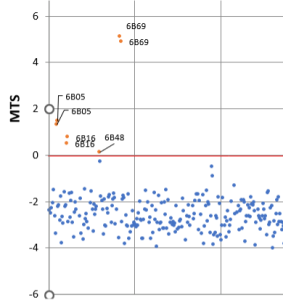
In a GRR attribute study, we are simply evaluating whether an inspection method gives the same result (Pass/Fail) repeatedly. Sometimes customers ask us to demonstrate that we can ‚get the same answer 3 times in a row for X passing parts and Y failing parts‘ (for example). In most PCRT applications, this Pass/Fail decision is made based on comparing a metric (or often 2) to a threshold. In our VIPR applications, the metrics are the MTS and Bias Scores. In our Z Score applications, the metrics are the Average Z Score and Z Deviation. When we evaluate the results of the attribute study, we prioritize the pass/fail result, but we also look at the repeatability of the metrics. For example, in the study below, Parts 6B05, 6B16 and 6B89 all failed twice in a row, with very similar MTS scores (above the threshold). Part 6B48 failed one time, and passed one time, but the variation in the metric is very similar – the part just happens to be nearer the threshold. If the GRR set includes 6B48, the repeatability may look lower than if the set includes only the other parts.
Sample GRR Reports
The attachment shows sample reports for both quantitative and attribute GRR studies for PCRT inspections. Either approach can be taken for your PCRT application.
Contact Us
Contact your Vibrant Application Engineer to discuss a GRR study for your application, or reach out to us to see if PCRT can meet your MSA requirements.


